Bike Share Ridership Deliverables Report
1. Executive Summary
This deliverables report examines ridership on a major U.S. city bike share program between 2017 and 2020, with a focus on evaluating whether a 2019 electric-bike fleet expansion produced a measurable shift in ridership trends. SABI Analytics applied time series decomposition and interrupted time series (segmented) regression — a quasi-experimental observational study design — to separate seasonal ridership patterns from underlying trend changes and isolate the effect of the fleet expansion from ordinary seasonal variation.
2. Trend & Seasonality Decomposition
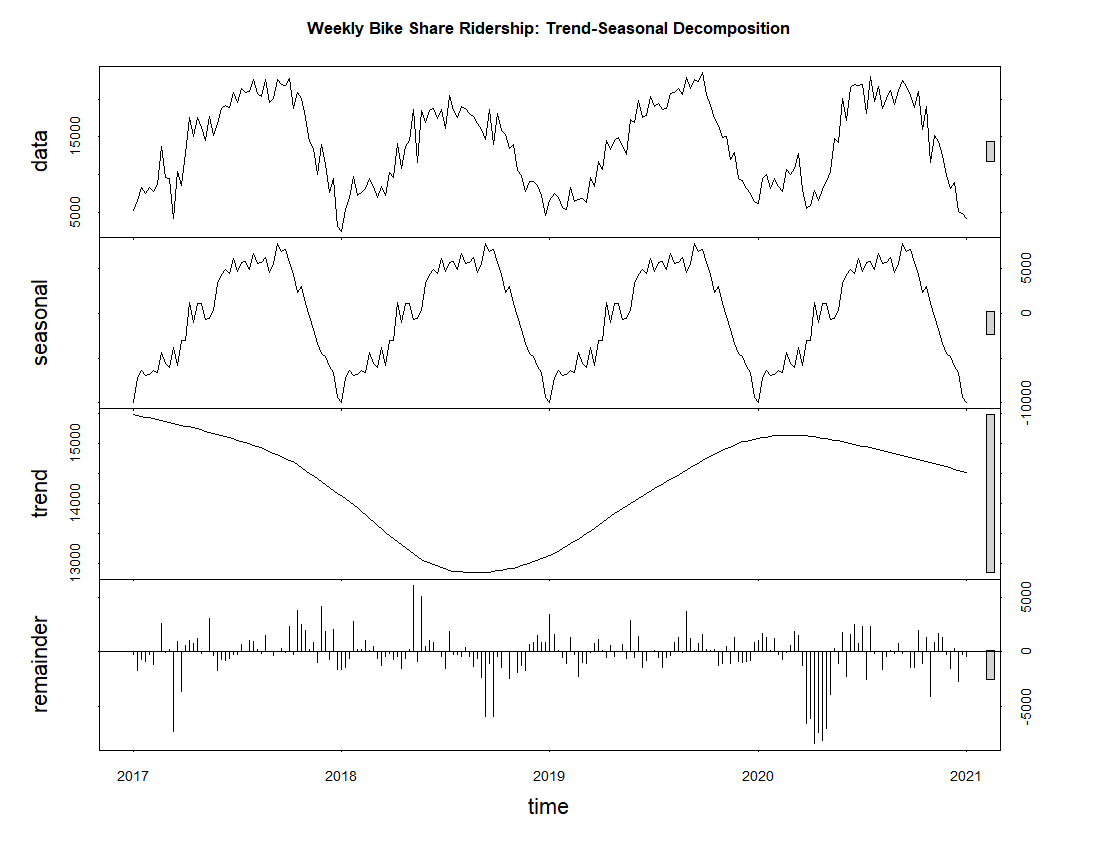
Weekly ridership from January 2017 through December 2020 was decomposed into trend, seasonal, and residual components. The seasonal component shows a strong, consistent annual cycle, with ridership peaking in summer months and falling in winter. The trend component reveals a shift in trajectory coinciding with the fleet expansion period, shown by the dashed reference line below.
3. Interrupted Time Series Analysis
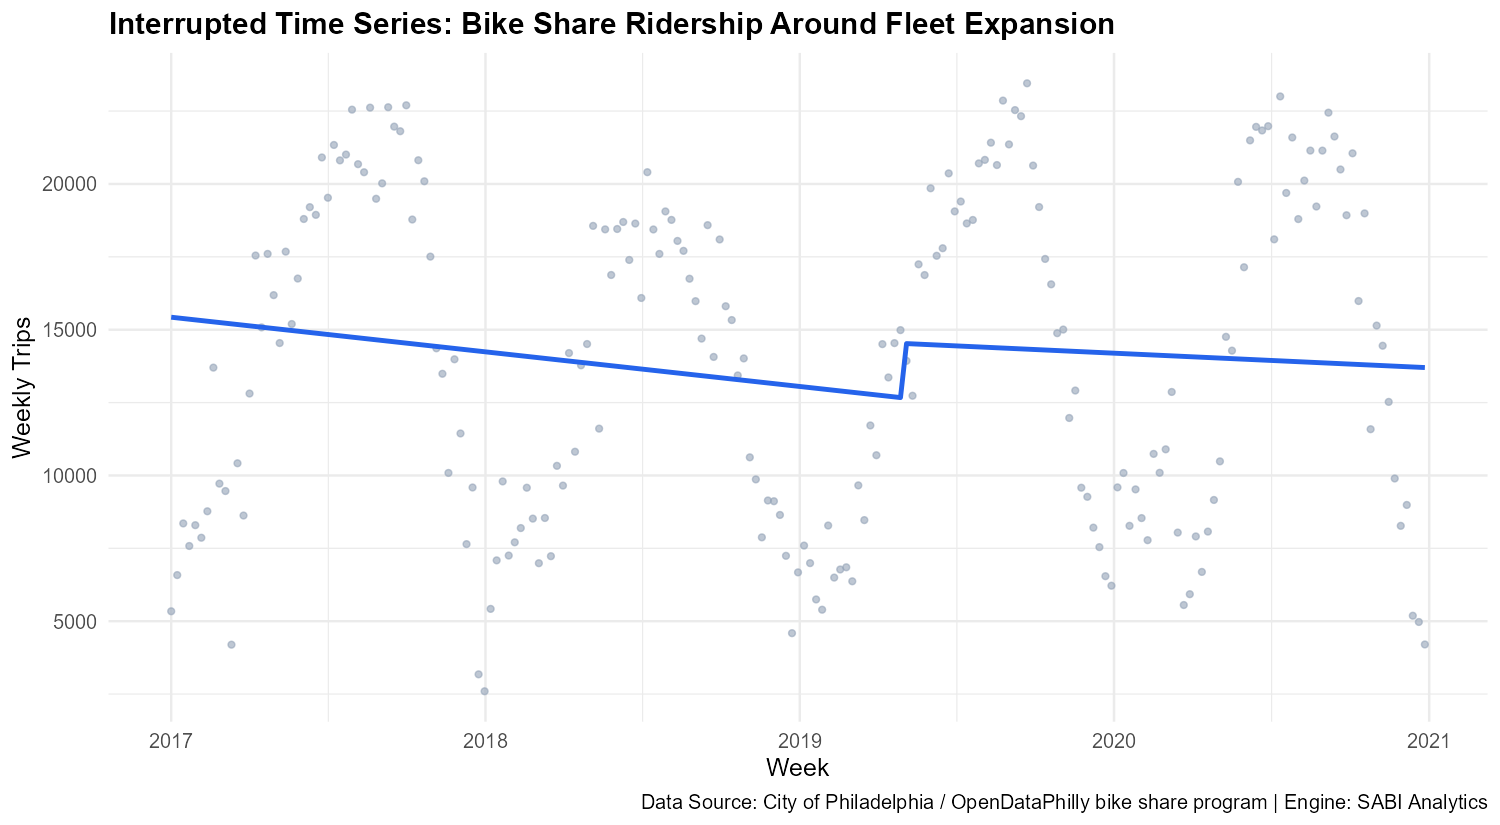
To formally test whether the fleet expansion coincided with a statistically significant change in ridership, a segmented regression model was fit to the weekly trip series, controlling for annual seasonality using harmonic (sine/cosine) terms and using heteroscedasticity- and autocorrelation-robust standard errors.
| Term | Estimate | Std. Error | t value | Pr(>|t|) |
|---|---|---|---|---|
| Intercept | 15,428.14 | 637.73 | 24.192 | <0.001 |
| Pre-existing weekly trend | -22.78 | 9.58 | -2.378 | 0.018 |
| Level shift at expansion | 1,874.61 | 1,144.93 | 1.637 | 0.103 |
| Trend change after expansion | 13.23 | 19.19 | 0.689 | 0.492 |
Interpretation: Prior to the fleet expansion, weekly ridership was on a statistically significant declining trend (p = 0.018). At the point of expansion, ridership shows an immediate increase of roughly 1,875 trips per week; however, this level shift does not reach conventional statistical significance (p = 0.103). The rate of ridership growth after the expansion was also not significantly different from the rate beforehand (p = 0.492). Taken together, the visual pattern is suggestive of an immediate boost in ridership around the time of the expansion — arresting a prior decline — but the formal test does not provide strong statistical evidence for this effect at conventional confidence levels. A larger post-intervention window or additional control variables (e.g., weather, regional cycling trends) would likely sharpen this estimate. This distinction between visually suggestive patterns and formally significant effects is precisely the discipline the interrupted time series approach is designed to enforce.
4. Station Usage Segmentation
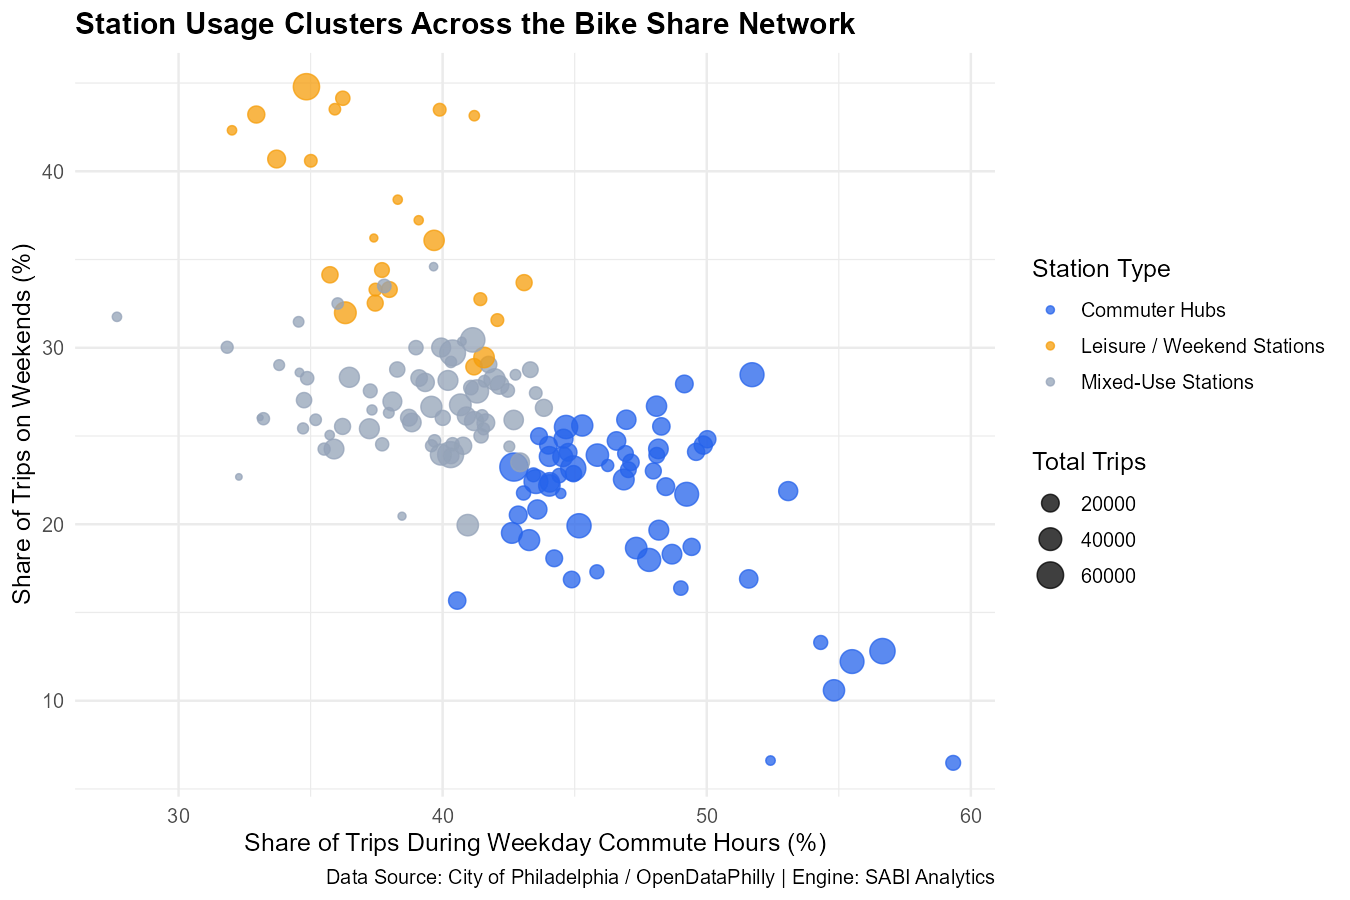
To complement the time series findings, station-level ridership was analyzed using k-means clustering on each station's weekday commute-hour share, weekend share, and membership composition. Three distinct station profiles emerged: commuter hubs with high weekday commute-hour and membership shares, mixed-use stations reflecting balanced ridership patterns, and leisure-oriented stations with the highest weekend share and a larger proportion of casual (non-member) riders.