SABI Analytics
Longitudinal Analytics Deliverables Report
Student Performance Trajectories & Mixed-Effects Modeling Analysis
1. Executive Summary
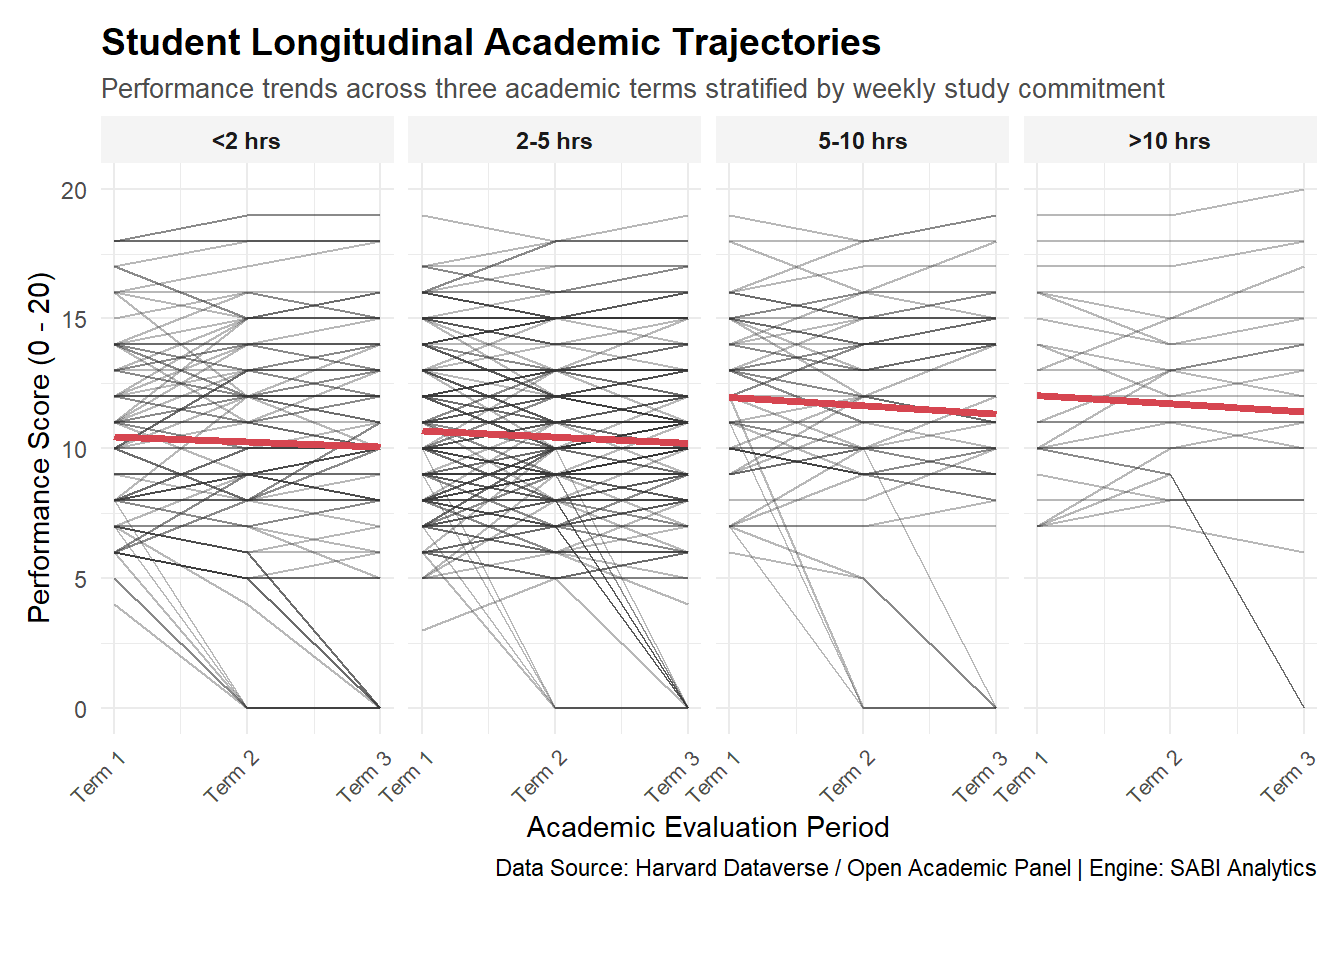
This deliverables report outlines the complete analytical pipeline and findings derived from the student longitudinal performance dataset. By utilizing advanced linear mixed-effects modeling, SABI Analytics successfully accounted for repeated student measures and individual baseline variances over multiple evaluation time points.
2. Statistical Model Results
| Term | Estimate | Std. Error | df | t value | Pr(>|t|) |
|---|---|---|---|---|---|
| (Intercept) | 10.172 | 0.573 | 423.645 | 17.747 | 0.000 |
| time_point | -0.247 | 0.057 | 789.000 | -4.323 | 0.000 |
| studytime | 0.523 | 0.217 | 391.000 | 2.416 | 0.016 |
| failures | -1.799 | 0.233 | 391.000 | -7.725 | 0.000 |
| sexM | 1.136 | 0.358 | 391.000 | 3.168 | 0.002 |